Revealed : Why COP27 is just a lot of very expensive hot air
Montage © Facts4EU.Org
This report has been co-published with our affiliated organisation, Brexit Facts4EU.Org. We are most grateful for their original research into the raw data which backs what follows.
Forget grandstanding politicians, we bring you the stark reality of the nonsense on show
Whether you’re a tree-hugger or a climate change sceptic, everyone should at least know the facts
As the UN’s Secretary General tells us all “The End of the World is Nigh”, CIBUK.Org shows conclusively that the United Kingdom is not responsible and should not be required to pay to put things right.
World leaders can pose and posture at the latest summit taking place in Egypt right now – as Rishi Sunak has been doing – but it can’t take away from the stark realities and hypocrisies which underpin this expensive and futile event. When it comes to ‘climate change’ one thing the world is not short of is data.
One question puts COP27 neatly into perspective
“If these 27 climate summits have been so vital to ‘save the planet’, why have greenhouse gases
continued to rise every single year since the summits started?”
Readers will have different views on ‘climate change’ but this report merely picks out one key indicator and puts it in the Facts4EU.Org data furnace to see what comes out. We could have added many others, but we like to keep our reports short and punchy.
Coal – the largest producer of CO2 emissions
Burning coal is recognised by all climate change scientists as being the largest cause of CO2 emissions. We summarise below who is burning coal and how the UK stands in the world rankings.
Summary
Electricity power generation from coal-fired power stations
China is the worst offender – more than half the world’s electricity from burning coal
- China : 52.1%
- India : 12.4%
- United States : 9.6%
- European Union : 4.3%
- Japan : 2.9%
- South Korea : 2.1%
- South Africa : 2.0%
- Russia : 2.0%
- Indonesia : 1.9%
- Germany : 1.6%
- Australia : 1.3%
- Poland : 1.3%
- Taiwan : 1.3%
- Vietnam : 1.1%
- Turkey : 1.0%
- Malaysia : 0.8%
- Kazakhstan : 0.7%
- Philippines : 0.5%
- Canada : 0.4%
- Ukraine : 0.4%
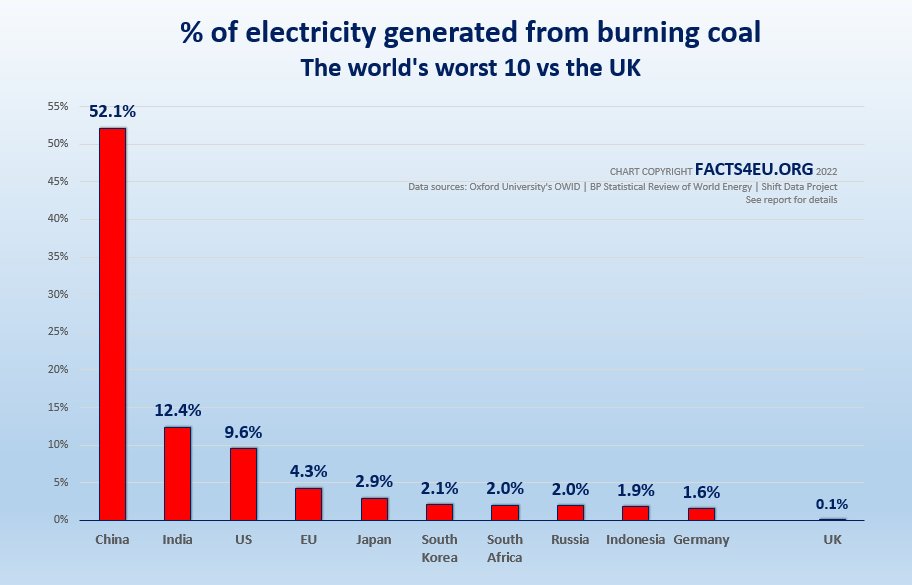
The UK is at No.41 (after Mongolia) on 0.1%.
© Brexit Facts4EU.Org 2022 – click to enlarge
[Sources : See bottom of this report.]
If anyone pays, it should not be the United Kingdom
One country stands out in every metric on greenhouse gases : China. In the example we have chosen, China burns more coal to power its country and its industries than any other country in the world – by a very long way.
Worse still, it has continued its rapid building of new coal-fired power stations at a rate unequalled anywhere in the world.
Putting the UK into the EU context, the United Kingdom’s figure for burning coal for electricity generation is just 1.48% of the EU’s total. Together, Germany and Poland account for 67% of the EU’s total. Compared with the UK, Germany burns an astonishing 45 times more coal for electricity than the UK.
The hypocrisy of ‘exporting carbon footprints’
We must now ask a second key question: “What is China doing with all this electricity?”
Over the past 20 years the policies pursued by the Chinese Communist Party (CCP) have seen a large rise in its manufacturing sector and in its exports of goods worldwide. In turn, China’s use of energy has increased enormously and this just continues to grow, with the building and commissioning of coal-fired power stations fuelling the growth. This continues to this day, despite any token statements about climate change from the CCP.
To give some indication, Facts4EU.Org has analysed the latest figures from the Office for National Statistics, looking at the growth in imported goods into the UK from China.
Summary
The 20-year growth in UK goods imports from China – a 10-fold increase
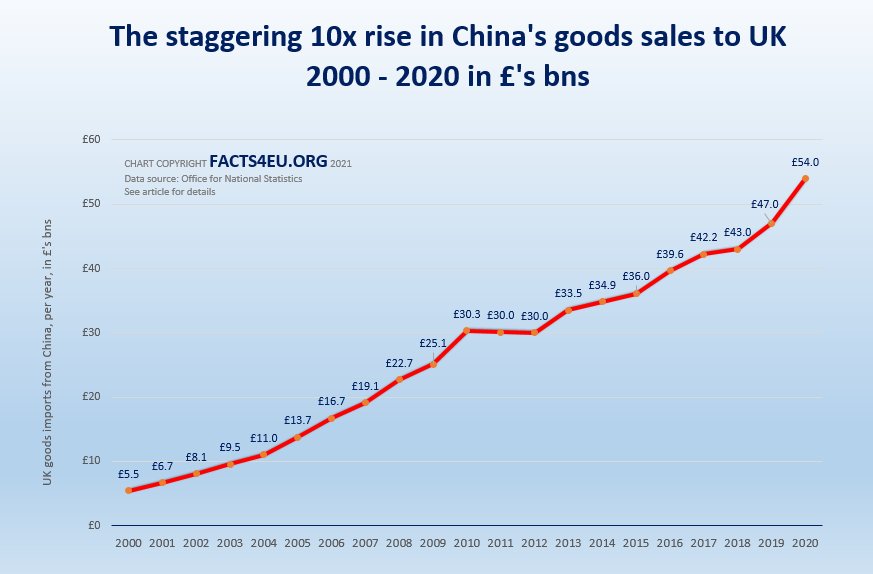
- 2000 UK imports of goods from China: £5.45bn
- 2020 UK imports of goods from China: £54.00bn (almost 10 times)
© Brexit Facts4EU.Org – click to enlarge
Meanwhile, Britain’s balance of payments deficit with China has ballooned. In 2000 it stood at -£3.75bn. At the end of 2020 it was -£36.35bn.
The products the UK and the World buys from China are initially powered by coal
The number one source of CO2 is the burning of coal. And it is coal that is powering China’s manufacturing base, which in turn churns out the increasing quantity of goods sold to the rest of the World.
China’s responsibility in this area dwarfs that of any other country. Below is a chart showing the top 10 countries using coal-fired power stations.
Summary
Number of coal-fired power stations – the top 10 countries
NOTE: This data is from 2019 and the numbers will be even higher now.
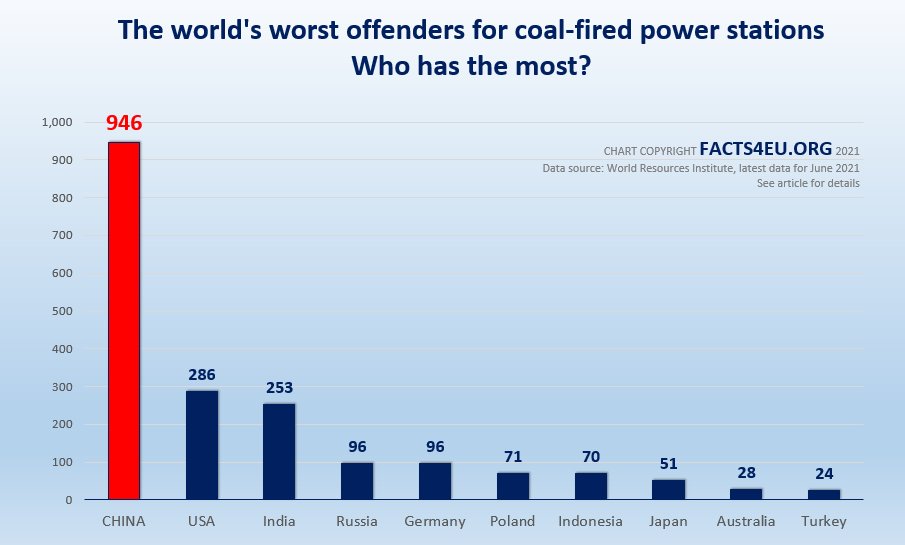
- China : 946
- USA : 286
- India : 253
- Russia : 96
- Germany : 96
- Poland : 71
- Indonesia : 70
- Japan : 51
- Australia : 28
- Turkey : 24
© Brexit Facts4EU.Org – click to enlarge
Finally, how clean is Global Britain when it comes to coal?
On this score, as in so many others, Global Britain can hold its head up very high. In fact, the UK’s use of coal is now so tiny it would never show on any graph. To give some idea, China’s coal consumption in 2020 was 423 times that of the United Kingdom.
Readers can read much more on this subject in the China report Facts4EU.Org published last year.
Please support our work
For the original version of this article, click here: https://facts4eu.org/news/2022_nov_hot_air