Whichever way you look at it, the latest population and immigration data is astonishing
Montage © Facts4EU.Org
This report has been co-published with our affiliated organisation, Brexit Facts4EU.Org. We are most grateful for their original research into the raw data which backs what follows.
Will the UK soon be completely unrecognisable to our parents?
Analysis and summary of the latest census information
There are so many shocking headlines contained within the latest census information released yesterday by the Office for National Statistics it’s almost impossible to know where to start.
Our report today is neither racist nor xenophobic. It simply describes what England and Wales looked like in 2021 according to the official figures and highlights the changes since the last census 10 years earlier.
Our caveats
Caveat 1 – CIBUK.Org’s usual caveat on population and immigration figures applies: based on experience we don’t believe them. We believe they are significantly understated – see our fuller explanation in our ‘Observations’ below the facts.
Caveat 2 – These figures only relate to England and Wales and exclude Scotland and Northern Ireland. They were collected early last year and do not include changes in the last 18 months.
Summary
Population and immigration rises in England and Wales, 10 years to 2021
All information comes from the Office for National Statistics, 03 Nov 2022
1. General information
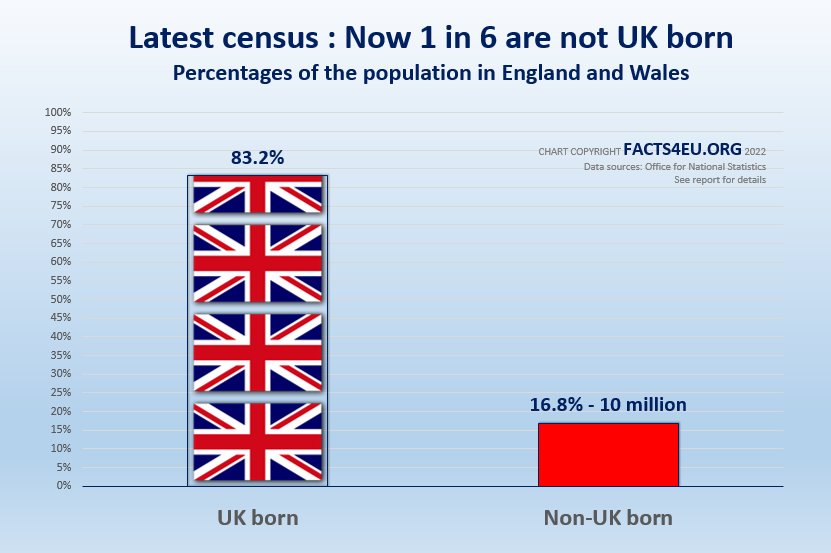
- 10 million usual residents of England and Wales (one in six) were born outside the UK
- This is an increase of 2.5 million since 2011, and represents 16.8% of the population
© Brexit Facts4EU.Org 2022 – click to enlarge
- Of the 10 million residents in England and Wales in 2021 who were not born in the UK, 4.2 million (42.4%) had arrived since 2011
- 680,000 non-UK born usual residents (6.8%) arrived between 2020 and Census Day, 21 March 2021
- India remained the most common country of birth outside the UK in 2021 with 920,000 people
- The population grew mostly because of immigration (57.5% of the increase), not because of the increase in births
- 545,000 usual residents had an address outside the UK one year before the census
2. The EU element

- EU citizens made up 3.6 million (36.4% of all non-UK born usual residents) of the population
- This is up from 2.5 million in 2011 and up from 1.2 million in 2001
© Brexit Facts4EU.Org 2022 – click to enlarge
Note: The ONS yesterday put the 2001 census figure for EU citizens at 1.4 million but we accessed the original, archived tables, which show 1,154,056. We believe the ONS are including nationals of countries which subsequently joined the EU, which paints the wrong picture.
- 5.9 million usual residents (9.9%) held a non-UK passport
- The most common non-UK passport held was Polish (760,000)
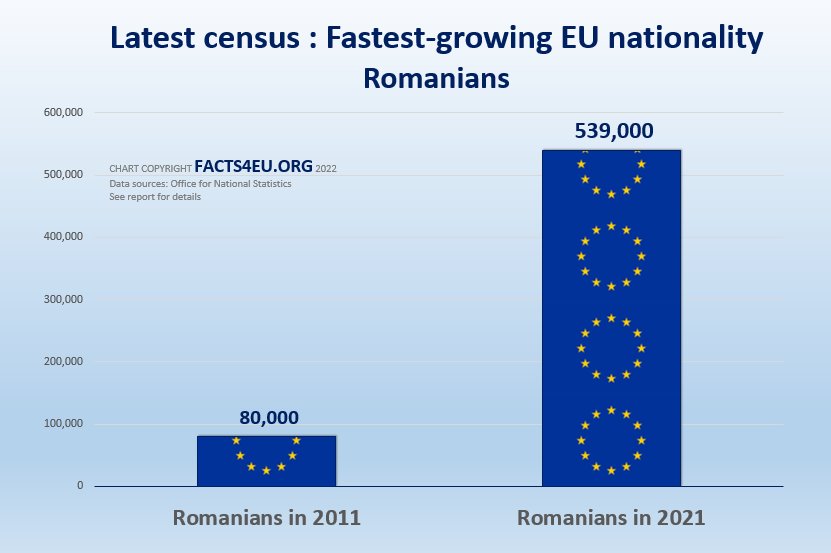
- The number of people who were born in the EU country of Romania grew by 576% since the previous census, from 80,000 in 2011 to 539,000 in 2021
© Brexit Facts4EU.Org 2022 – click to enlarge
3. London and the regions
- London has remained the region with the largest proportion of people born outside the UK
- In 2021, more than 4 in 10 (40.6%) usual residents in London were non-UK born
- 18 out of the top 20 Local Authorities with the highest proportion of non-UK born residents were in London
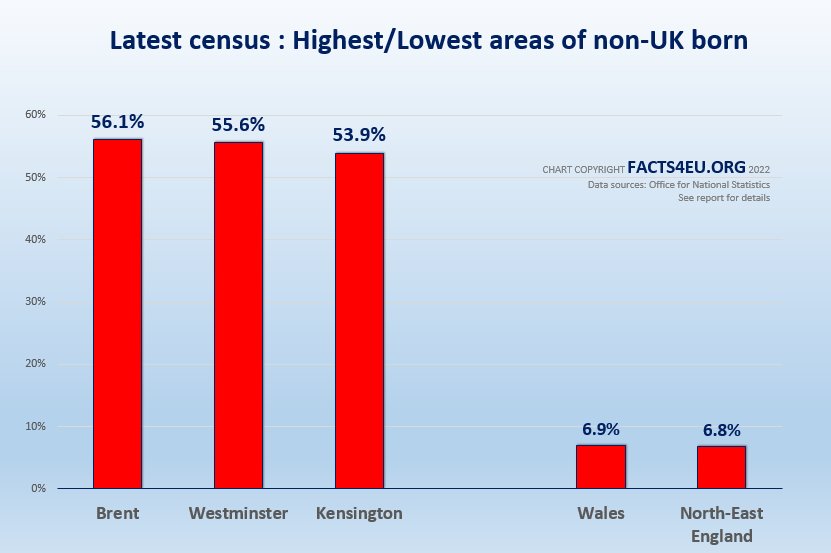
- The areas with the highest proportions were Brent (56.1%), Westminster (55.6%) and Kensington and Chelsea (53.9%)
- In contrast, both Wales (6.9%) and the North East of England (6.8%) had approximately 1 in 14 usual residents born outside the UK
© Brexit Facts4EU.Org 2022 – click to enlarge
4. The age profile
- 3.0 million non-UK born usual residents were under 18 when they arrived in the UK (30.2% of non-UK total)
- 4.3 million were aged 18 to 29 years, 2.1 million were 30 to 44 years
- 546,000 were 45 to 64 years, and 79,000 were aged 65 years and over when they arrived
5. Lastly, overall growth in net immigration since Tony Blair became PM
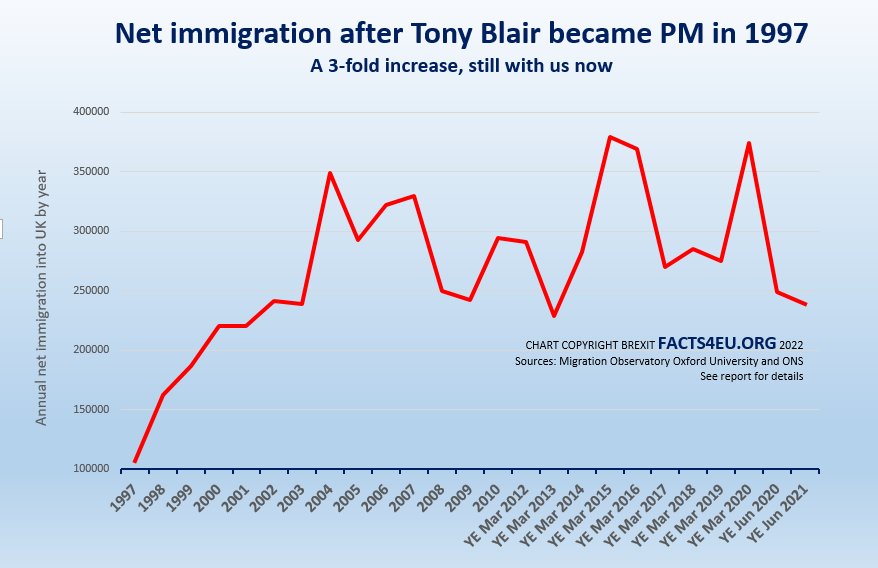
Finally, we show below the growth in net immigration since 1997, when Tony Blair became Prime Minister. It also covers the period of Prime Ministers Cameron, May, and Johnson, all of whom pledged to control immigration. Mr Cameron in particular pledged to reduce it “to the tens of thousands”.
© Brexit Facts4EU.Org 2022 – click to enlarge
For the original version of this article, click here: https://facts4eu.org/news/2022_nov_changing_population