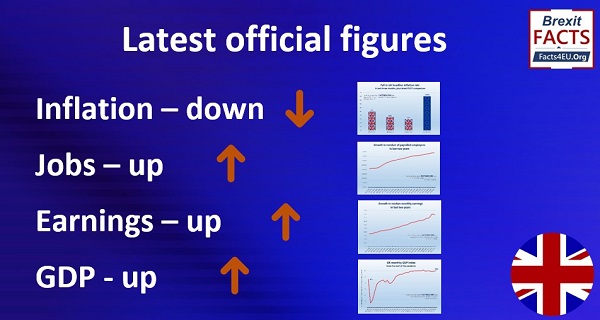
It is said by the three main political parties that the UK must remain in the EU because it is our major trading partner and hence vital to our prosperity.
Professor Tim Congdon CBE, with the help of figures from the International Monetary Fund (IMF) database (see below) explains: The numbers are immensely helpful because they extend over a 25-year period and so help in identifying trends. They start in 1991, when the Maastricht Treaty was being negotiated and the euro was conceived, and end with forecasts for 2016. (The analysis is slightly incomplete, because it ignores some of the smaller countries, but apart from Poland and Sweden none of these 10 countries is of much importance).
In 1981 the eurozone output represented 21.8% of the world output. Their problem was and remains, that the excessive taxation and heavy regulation inflicted on them by the EU has held them back. The figures show that the eurozone’s share of the world output has plunged by a third – from 21.8% in 1991 to 14.3% in 2011.
It is entirely plausible that out grandchildren will live in a world where the eurozone produces only 6 or 7 per cent of world output. In other words, in their world the nations that today have neither EU membership nor the euro as their currency will outweigh the eurozone by well over ten to one.
Eurozone as a percentage share of world output per year
| 1991 | 21.821 | 2000 | 18.349 | 2009 | 15.015 |
| 1992 | 20.172 | 2001 | 18.300 | 2010 | 14.556 |
| 1993 | 19.610 | 2002 | 17.968 | 2011 | 14.253 |
| 1994 | 19.485 | 2003 | 17.482 | 2012 | 13.861 |
| 1995 | 19.290 | 2004 | 16.989 | 2013 | 13.478 |
| 1996 | 18.887 | 2005 | 16.541 | 2014 | 13.100 |
| 1997 | 18.606 | 2006 | 16.235 | 2015 | 12.722 |
| 1998 | 18.659 | 2007 | 15.881 | 2016 | 12.350 |
| 1999 | 18.535 | 2008 | 15.534 |
First appeared in EuroFacts, 22nd June 2012
You may also like